Loan Vision Predictive Analytics & Modeling
Comprehensive Suite of Strategic Solutions

Finance Transformation in Mortgage Lending
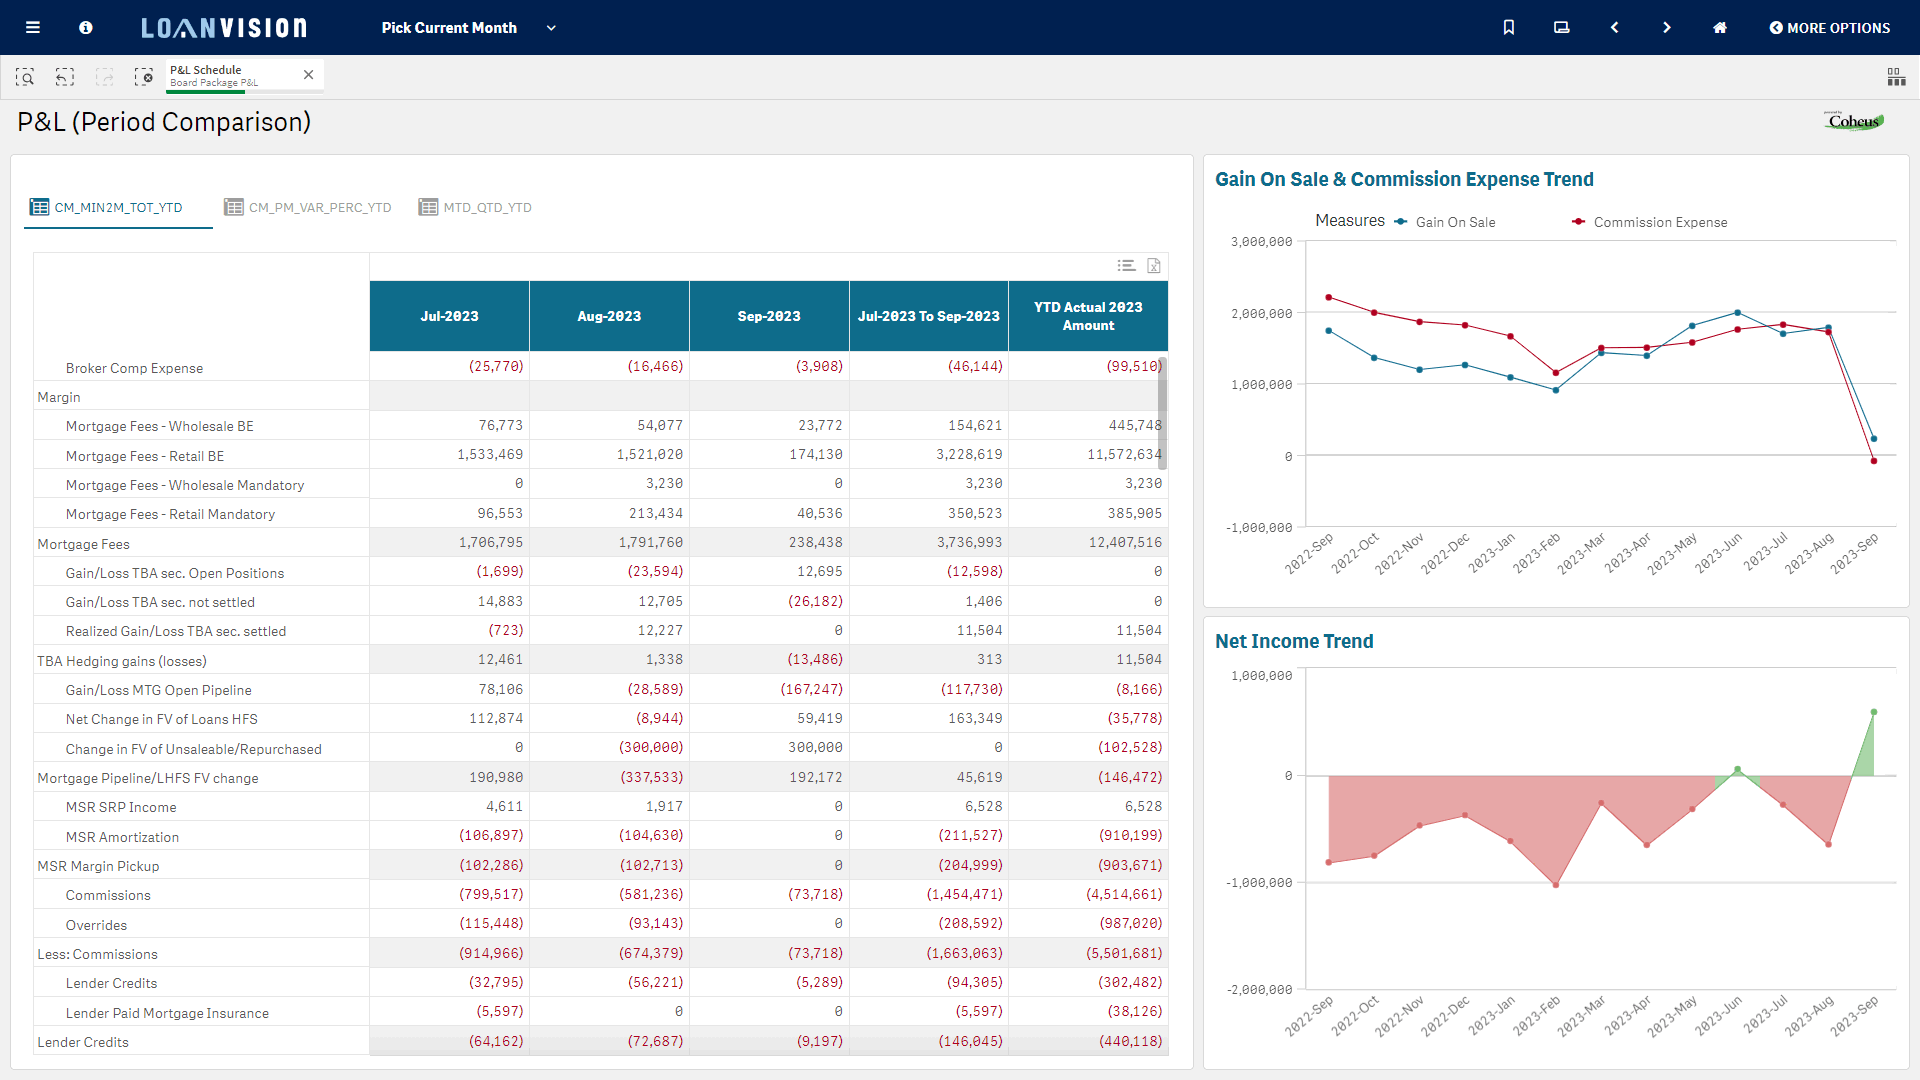
Software companies, report developers, and our friends in IT have unsuccessfully tried to solve our information needs by building complicated data cubes and/or providing a countless number of canned reports. To make things worse, business rules, field definitions and expressions are often buried in a massive array of code. There is one fundamental challenge that this traditional approach has failed to address: the question is different every day. Pre-aggregating results in a complicated cube or in dozens (even hundreds) of reports has been an impractical solution to the challenge from the beginning. It is simply not possible for a report developer, or an IT organization to anticipate every question that finance and business users need answered.
Finance & Accounting professionals’ response to this fundamental challenge is to download the data and essentially become data experts and spreadsheet wizards. This process is manual, time consuming and carries a myriad of risks. Worse, the knowledge and expertise that resides in the CFO’s organization becomes highly under-utilized as we consume all of our time and resources on efforts to describe “what happened”?
The ”Analytics Maturity Model”, originally published by Gartner over 10 years ago, has been adapted to describe a better future for mortgage lending firms. One where the potential and business acumen that resides in the CFO organization can be unlocked, where the journey to becoming a strategic business partner begins.
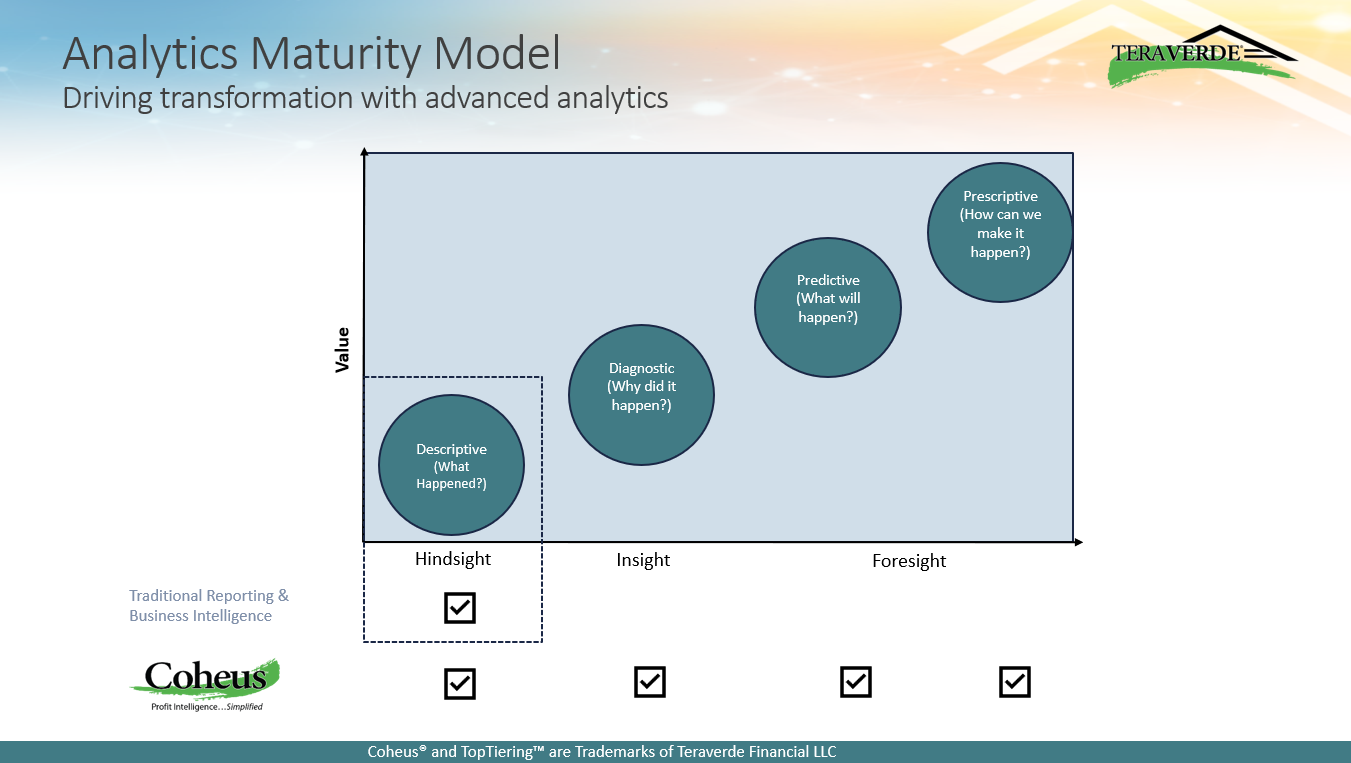
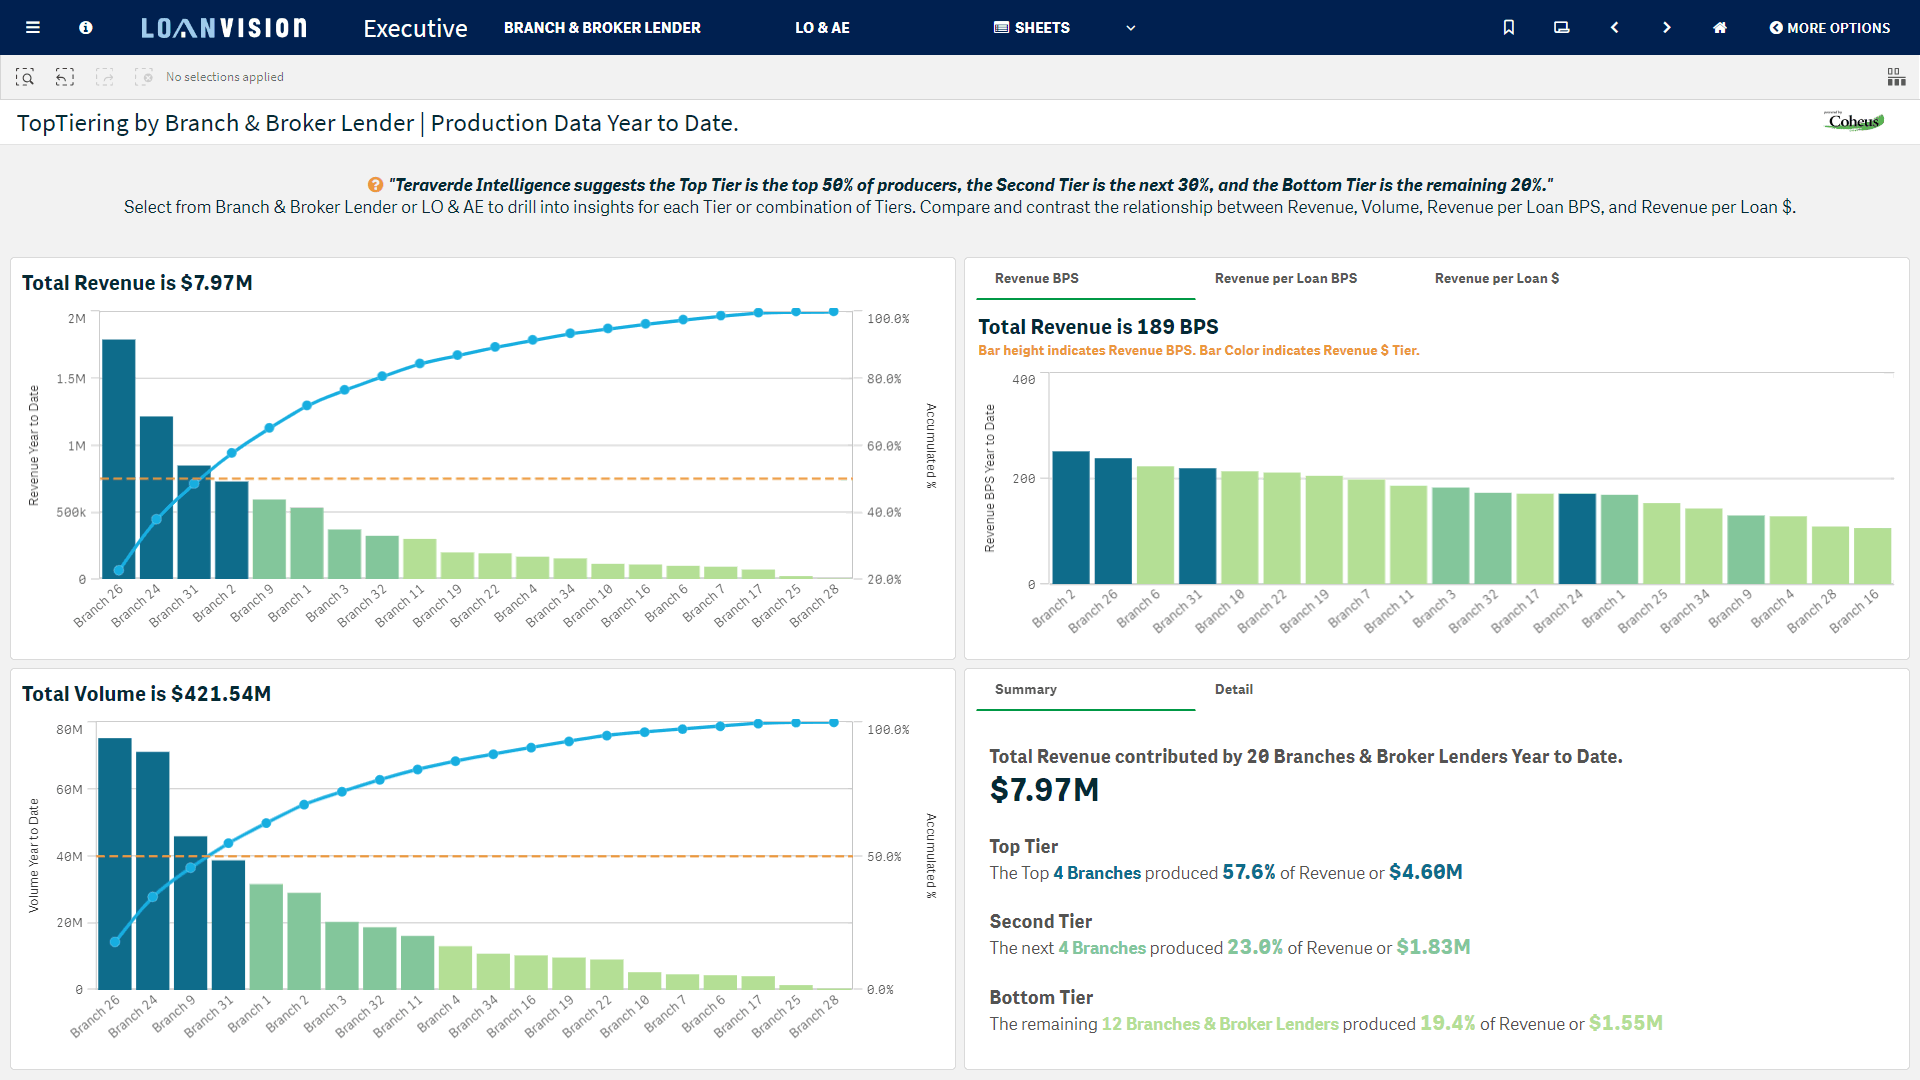
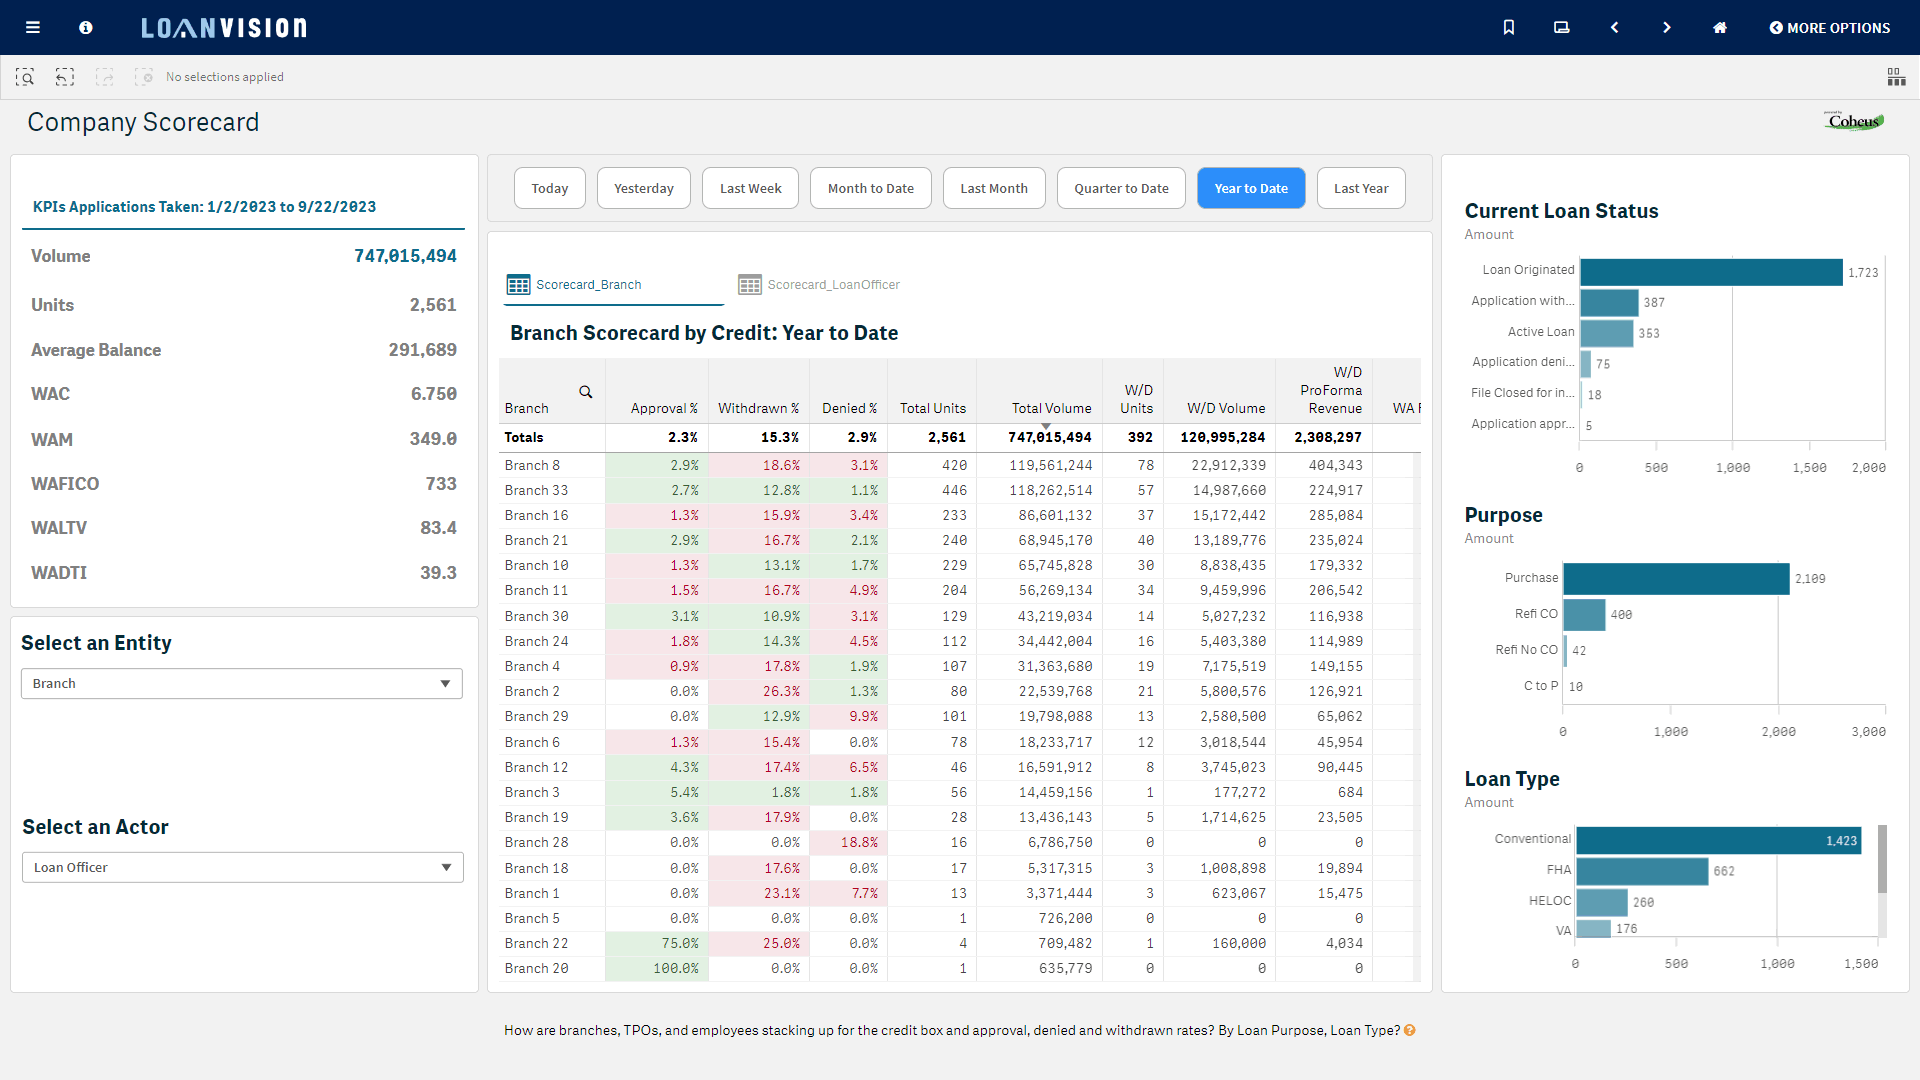
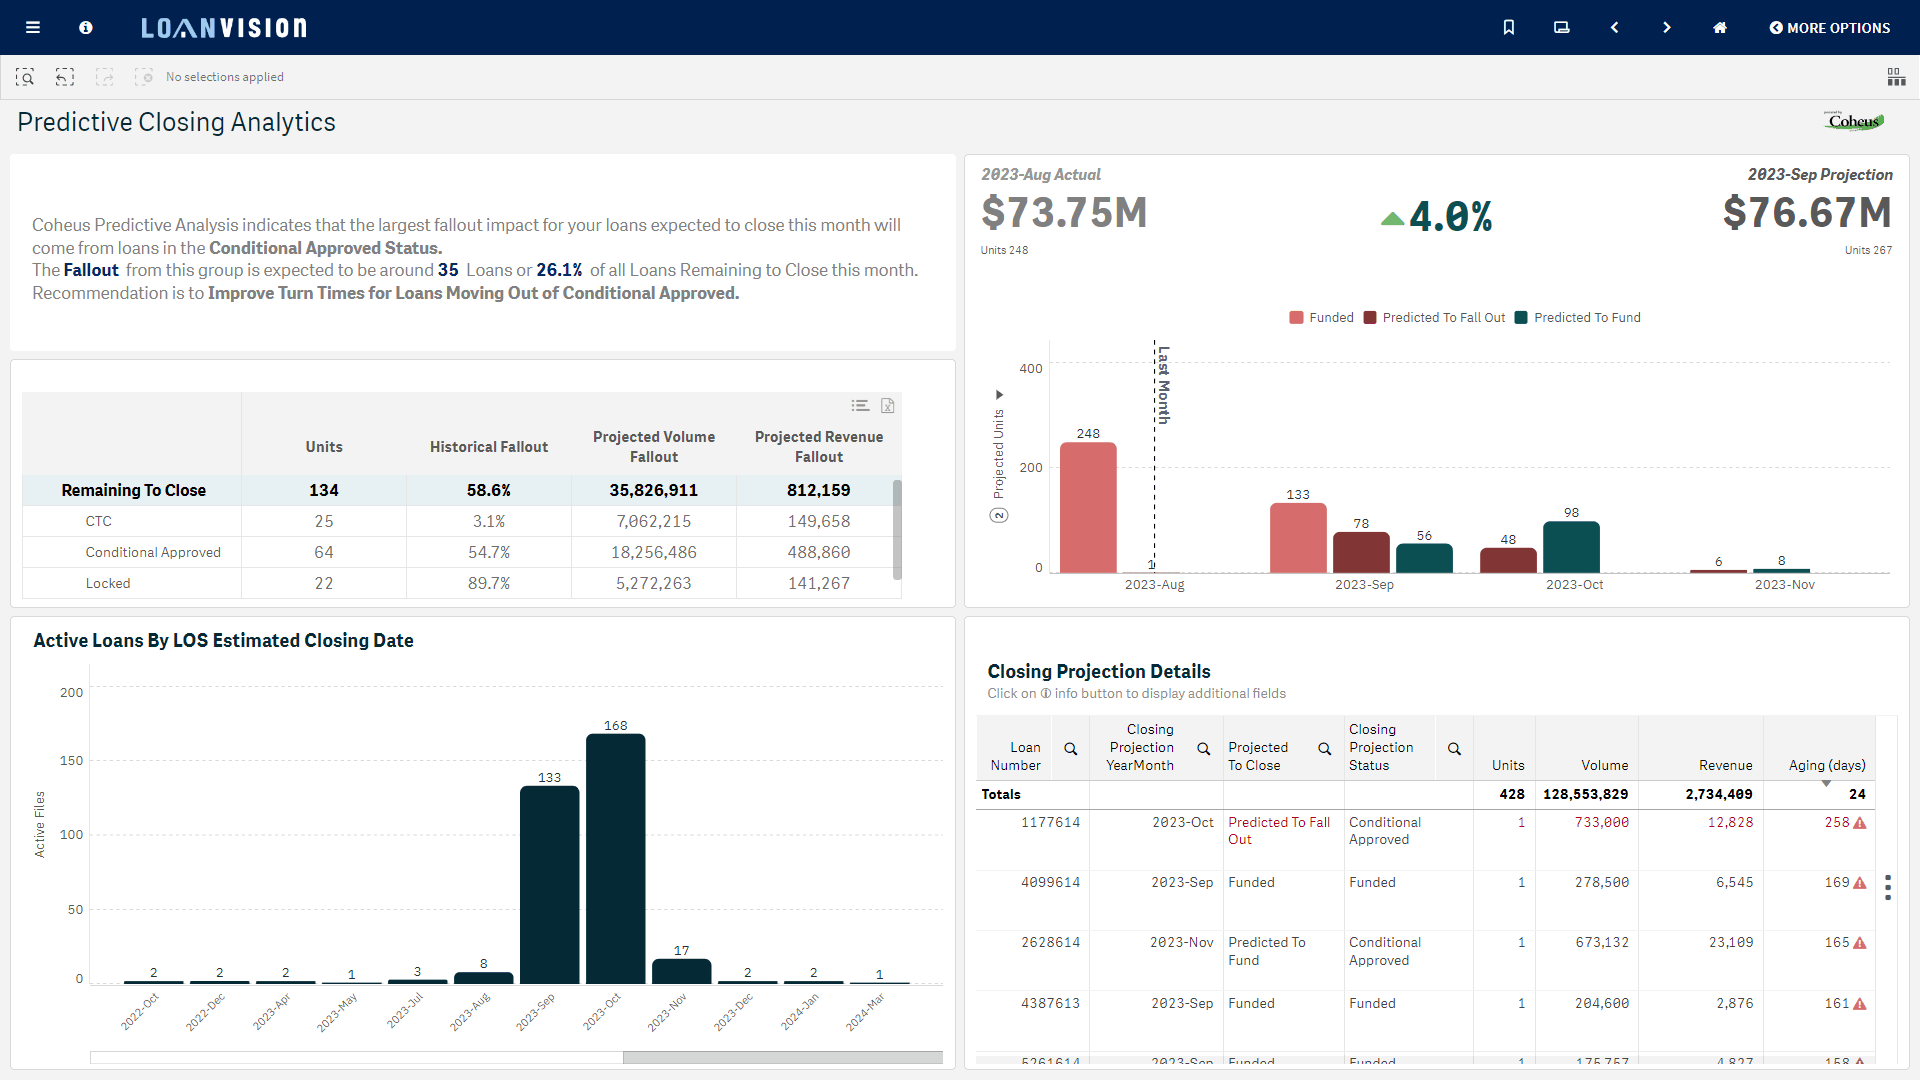
Loan Vision and Teraverde have created a technology partnership offering “Loan Vision Predictive Analytics & Modeling (LV-PAM). LV-PAM is powered by Coheus®, an award-winning data & analytics platform built specifically for the mortgage industry. We recognize that the path to becoming a strategic business partner starts with streamlining the non-value added activity described above but there is a very important second angle to our approach! We are delivering data & analytics solutions from both the General Ledger and the Loan Origination System to the Finance team and displaying it directly inside the Loan Vision system. These solutions are designed to:
- Transform the finance organization by streamlining and automating a significant amount of manual, risky, spreadsheet work
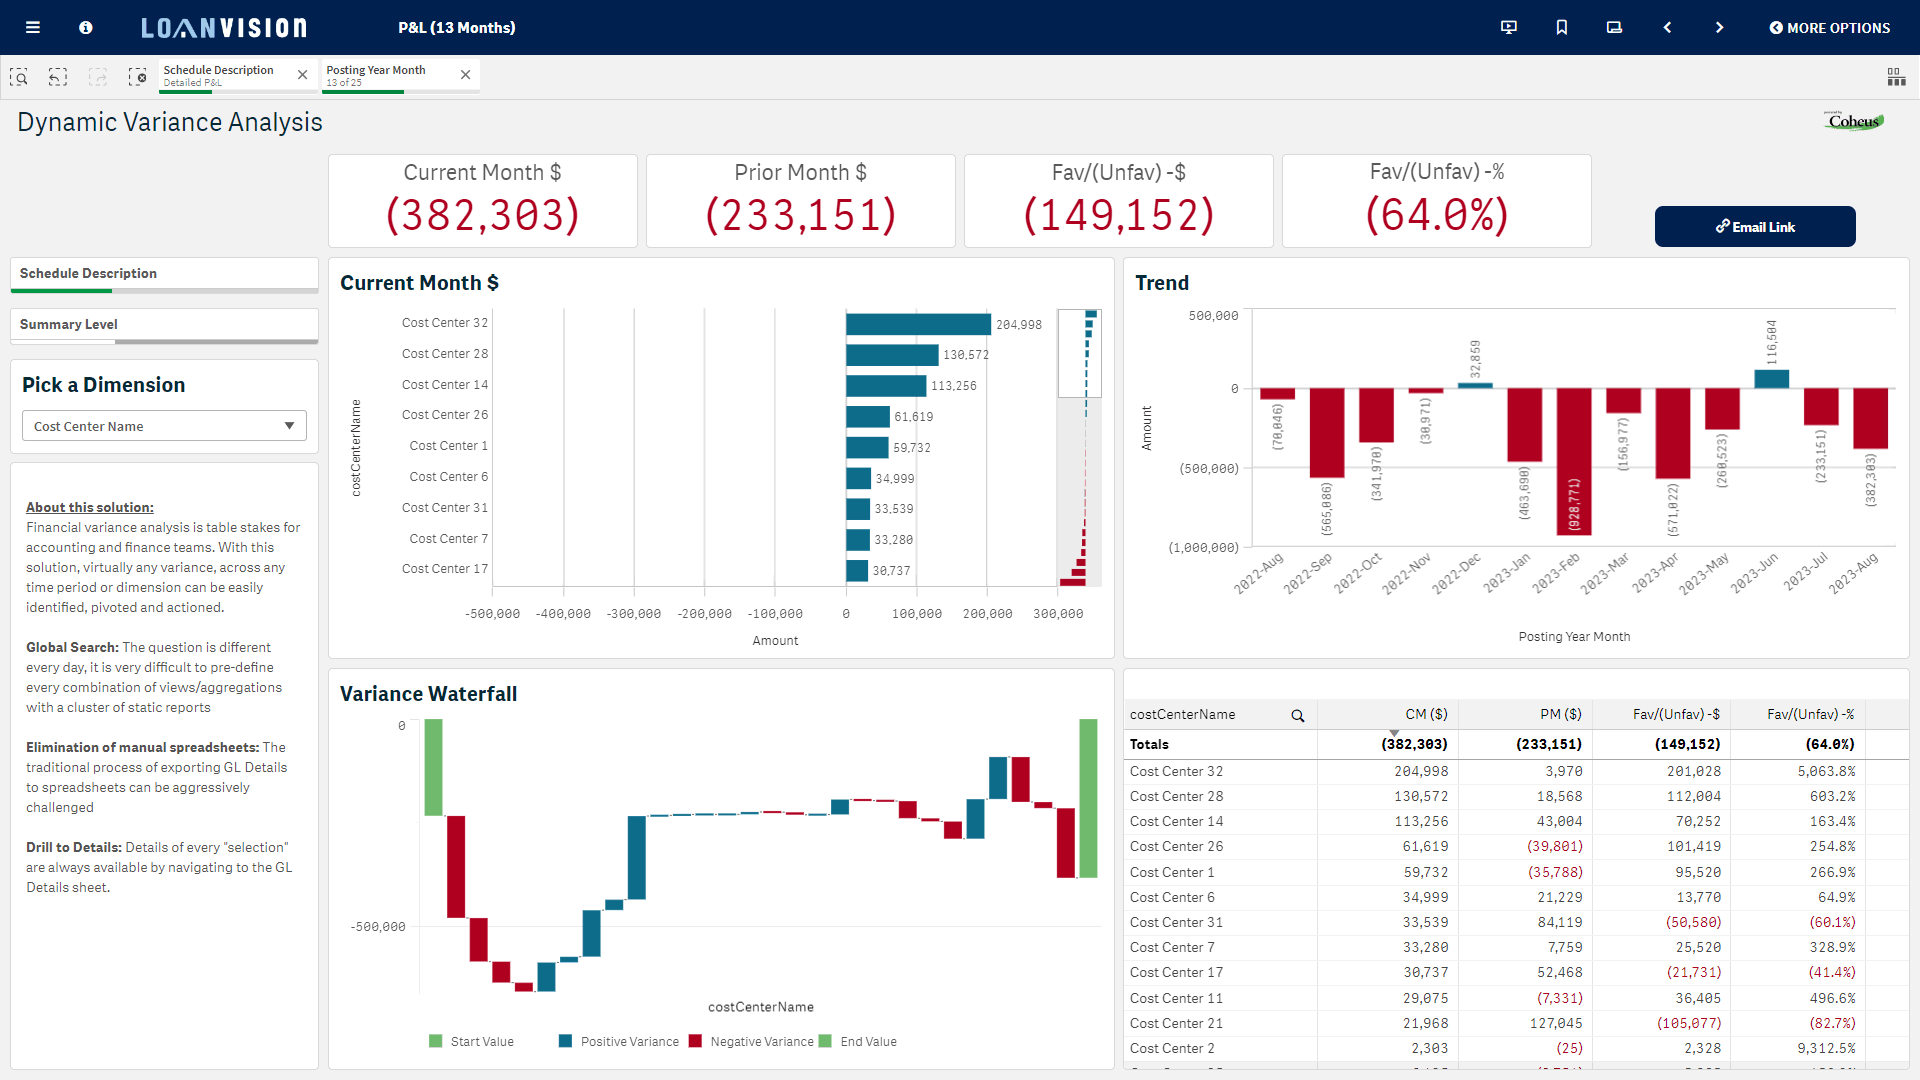
- Diagnose business related performance and its impact on the financial statements with un-matched visibility/transparency (with loan level detail)
- Predict month end close estimates at the loan level creating actionable insights; and
- Prescribe areas of the pipeline recommended actions to improve pull-through, organizational efficiency & profitability.
More to follow on top use cases that can be addressed using these game changing additions to the Loan Vision platform.
Paul Van Siclen
SVP, Client Strategies
Teraverde Financial
